Lab Practical
Author: Jacob Hoffner
Date: May 2016
Lab Partners: Alyssa Jordan and Zach Christoff
Date: May 2016
Lab Partners: Alyssa Jordan and Zach Christoff
Lab Purpose and Description
In this lab, we are to investigate the different factors that affect a pendulum.
We are to make graphs of the following:
Period vs. Mass of the Bob
Period vs. Length of the Pendulum
Period vs. Amplitude
We are to find the relationship between the two concepts in each graph that we are to make.
We are to make graphs of the following:
Period vs. Mass of the Bob
Period vs. Length of the Pendulum
Period vs. Amplitude
We are to find the relationship between the two concepts in each graph that we are to make.
Procedures in the Lab:
Mass of Bob vs. Period
- Record the mass being used
- Find the center of mass
- Release pendulum from same displacement from equilibrium each time (other words, amplitude)
- Count ten swings, then start stopwatch
- After twenty swings, stop stopwatch
- Add the three times measured from the three of us lab partners, divide by 3, then divide by 10
- We repeat this process ten times for data points
- Then record each mass and period for each data point in our chart
Length of the Pendulum vs. Period
- Record the length of the Pendulum
- We keep the same mass and release from the same displacement from equilibrium (other words, amplitude)
- Count ten swings, then start stopwatch
- After twenty swings, stop stopwatch
- Add the three times measured from the three of us lab partners, divide by 3, then divide by 10
- We repeat this process ten times for data points
- Then record each length of the pendulum and period for each data point in our chart
Amplitude vs. Period
- Record the amplitude being used in the x-direction
- Again we keep the same mass and now length in the string
- Let the pendulum swing for ten swings, then start stopwatch
- After twenty swings, stop stopwatch
- Add the three times measured from the three of us lab partners, divide by 3, then divide by 10
- We repeat this process ten times for the data points
- Then record each amplitude of the pendulum and period for each data point in our chart
Graphs and Other Data
|
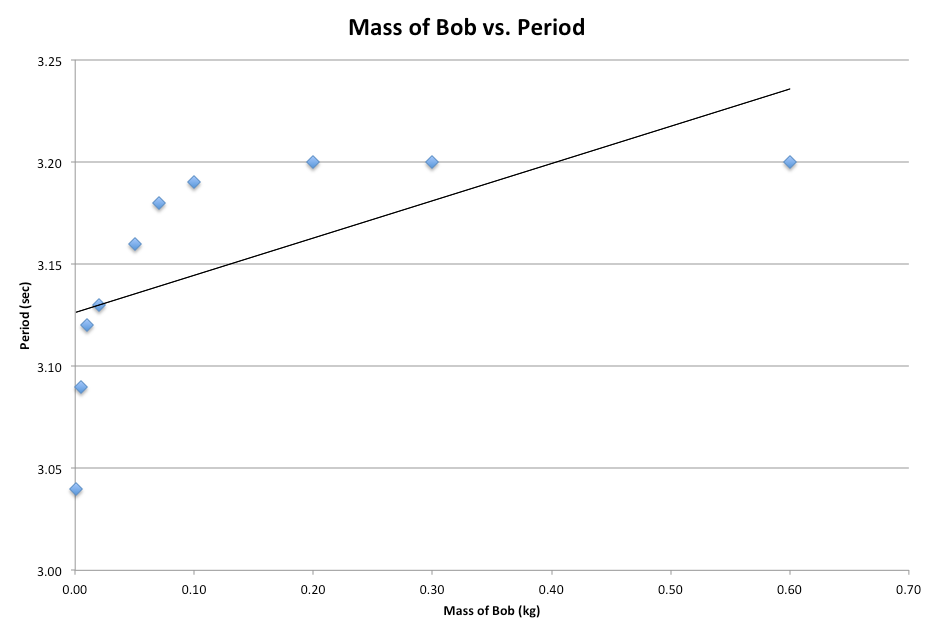
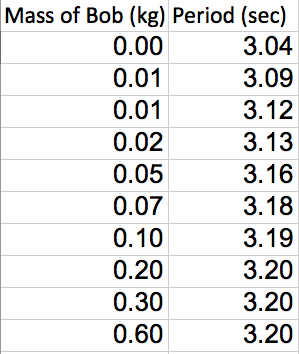
Mass of Bob vs. Period:
Here we see how the increase of mass of the bob of our pendulum increases the period of the pendulum. Mass of the string is neglected, as it has a very small mass. Mass, however, should not affect the period of the pendulum. Because we did not account for the center of mass for each run for this data, we had a constant error, resulting in this square root-looking graph. |
|
|
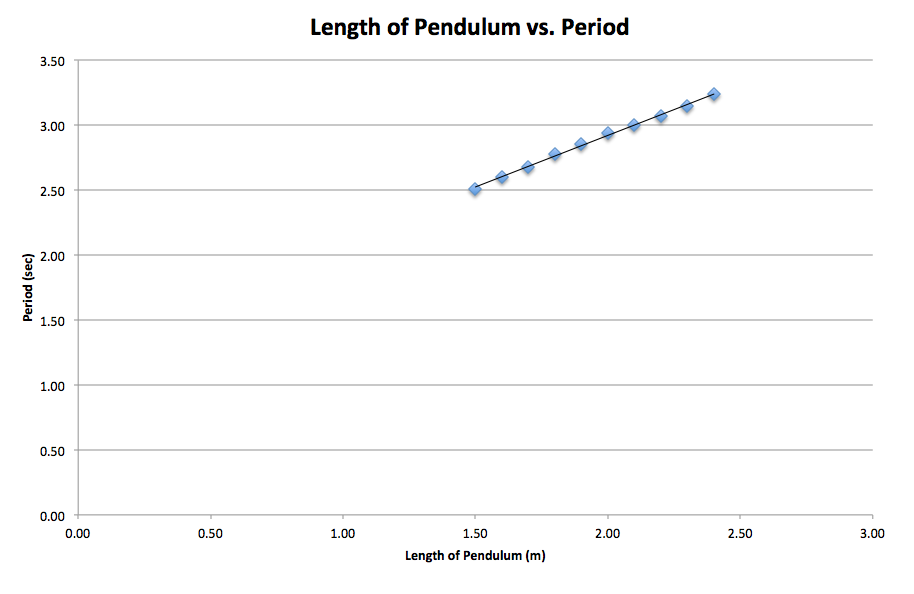
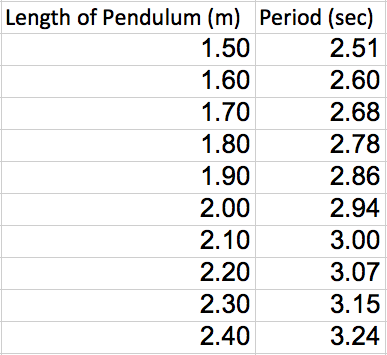
Length of Pendulum vs. Period:
As we increased the length of the pendulum, the period increased as well. This graph should actually display a square root graph, as period has a square root relationship with the length of the pendulum. We have created a linear graph. Everything else is constant in the relationship between period and length, as period is two times pi times the square root of the length over gravity. |
|
|
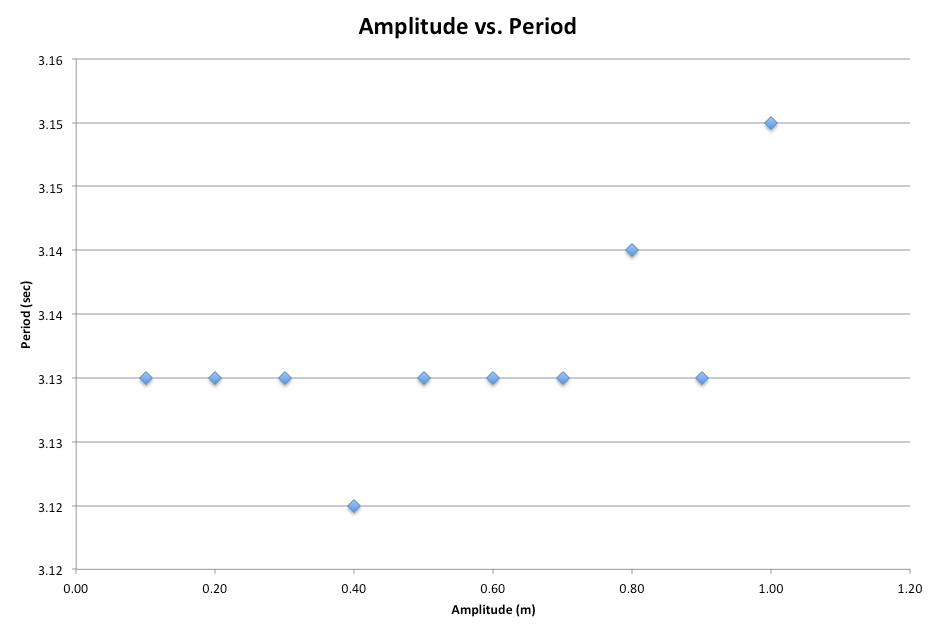
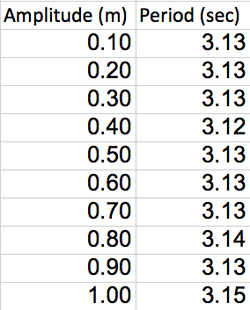
Amplitude vs. Period:
Amplitude does not (overall) change the period. As we can see (except for a few data points), the period is not affected as we change the amplitude. This mostly applies for larger angles, as we can see a slight change in period as larger angles are used to change the overall period of the pendulum. One can see this in the chart example below: 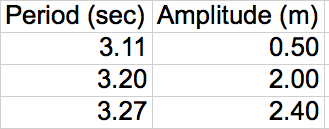
|
|
Further Data
Below is the data used to find the graphs above:
|
|
|
